How do I view charts and reports?
The Charts and reports button opens patient data: medical records, charts, heatmaps, reports, and PDF exports.
Where do I open the medical record?
Open the patient and click Charts and reports in the right consultation panel.
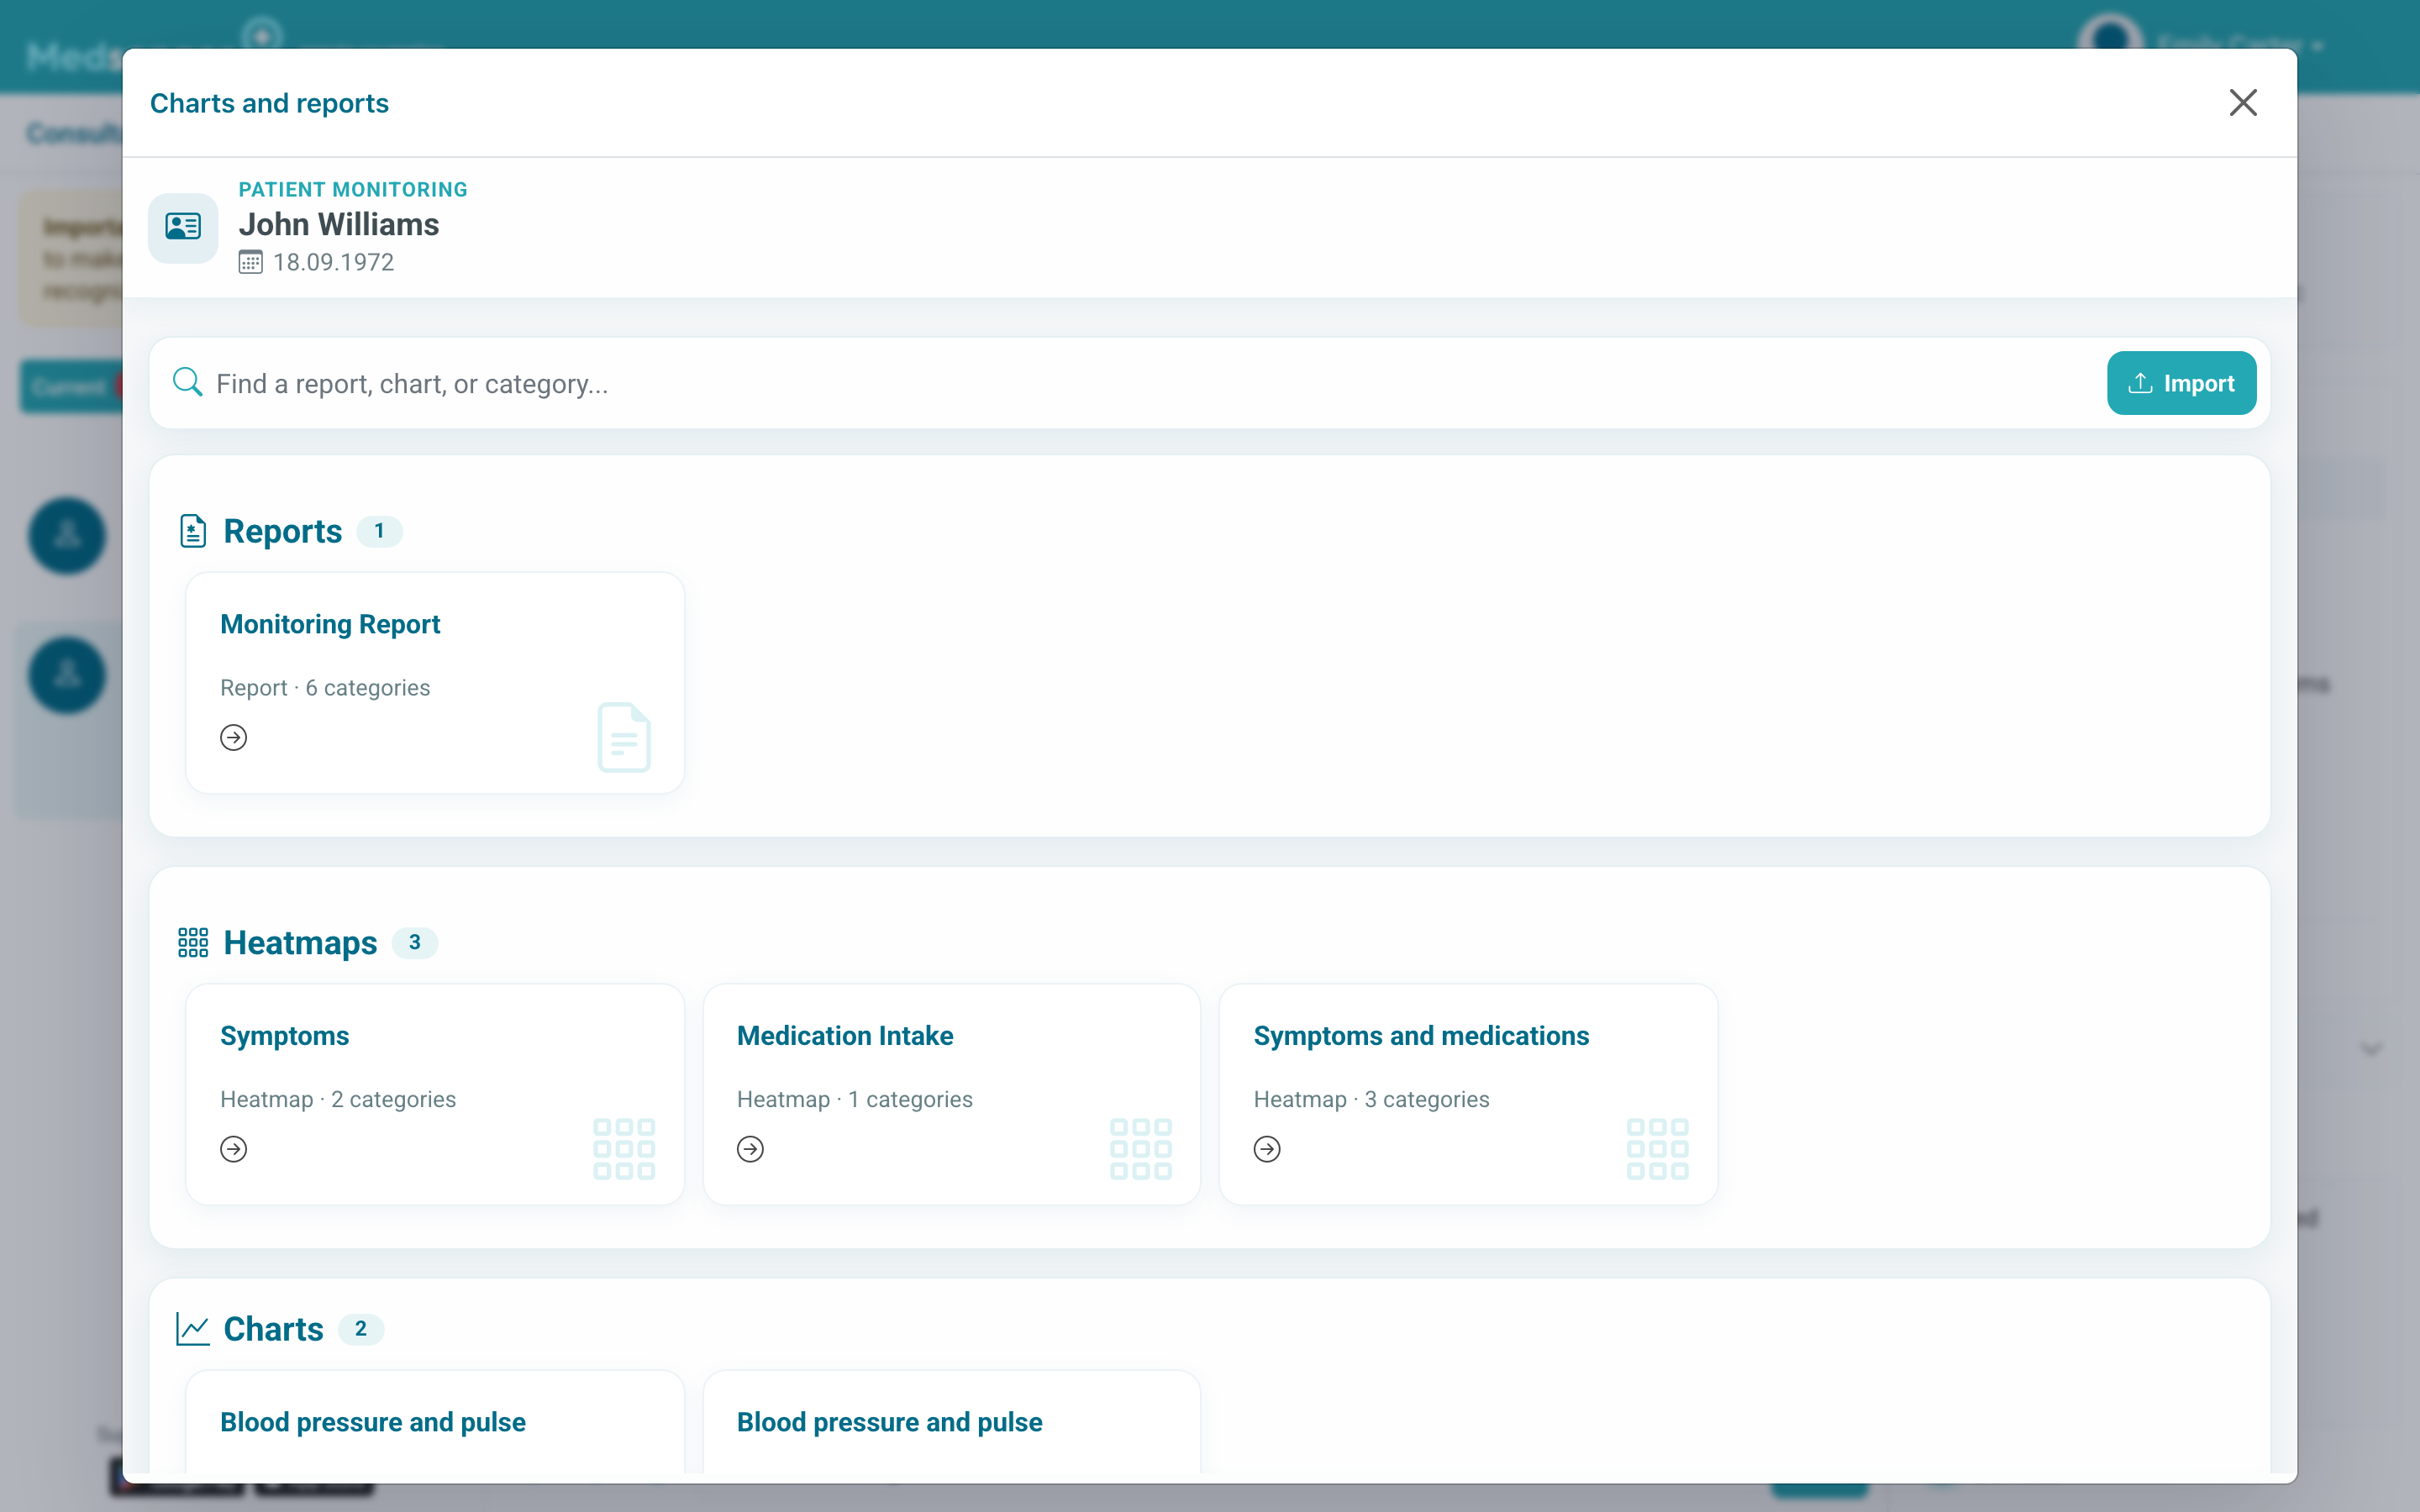
The set of cards depends on the monitoring scenario: blood pressure, pulse, weight, symptoms, medications, patient comments, device data, and other categories. Open the report that answers the current question: indicator dynamics, assignment completion, or complaint history.
How do I choose a period and download a report?
If there is little data or the chart is empty, first check the period. Expand the dates and make sure the patient filled in forms or sent measurements on the selected days.
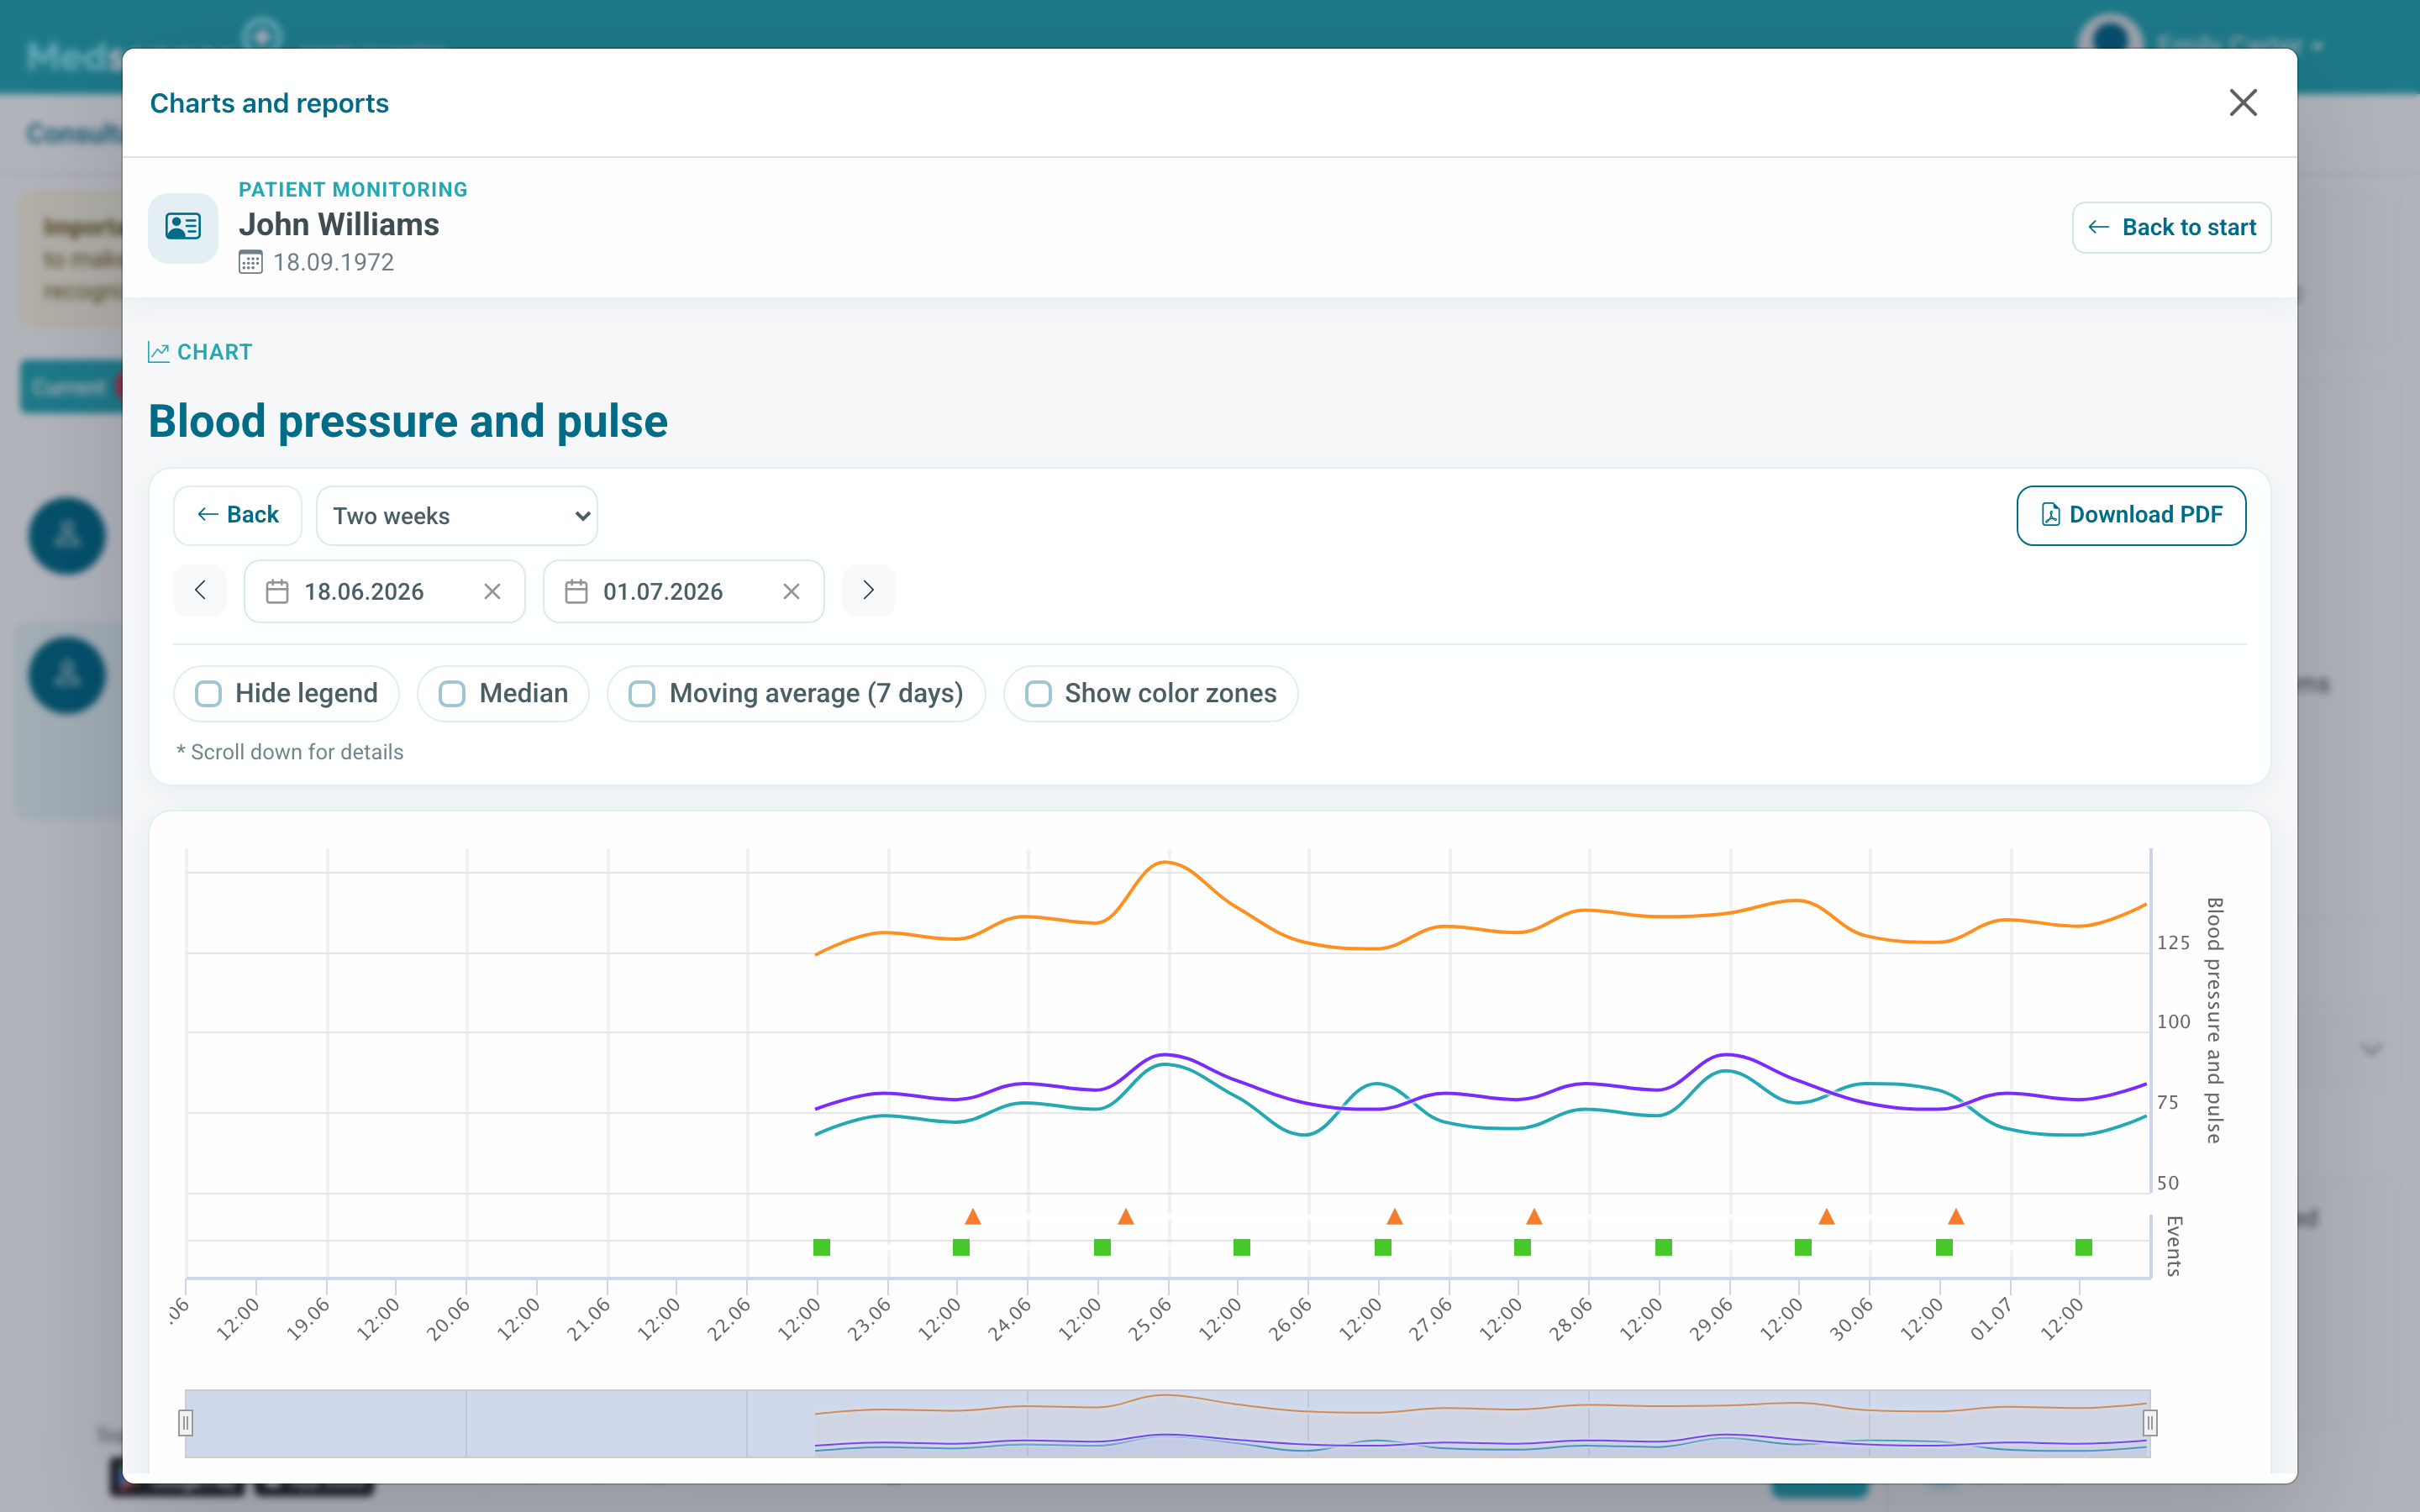
The period is selected at the top of the report. There may also be a Download PDF button if the selected report supports export. Before downloading, check the period and data categories.
Data may come from questionnaires, manual patient entry, devices, medication marks, and doctor actions.
A chat message by itself does not always become a medical record entry: for charts and reports, data must enter the correct category. If there is no data, use the short diagnostic guide: no data in medical record.
How do I read charts?
View numeric indicators over time. For blood pressure and pulse, pay attention to measurement regularity, outliers, stable increase or decrease, and connection with complaints.
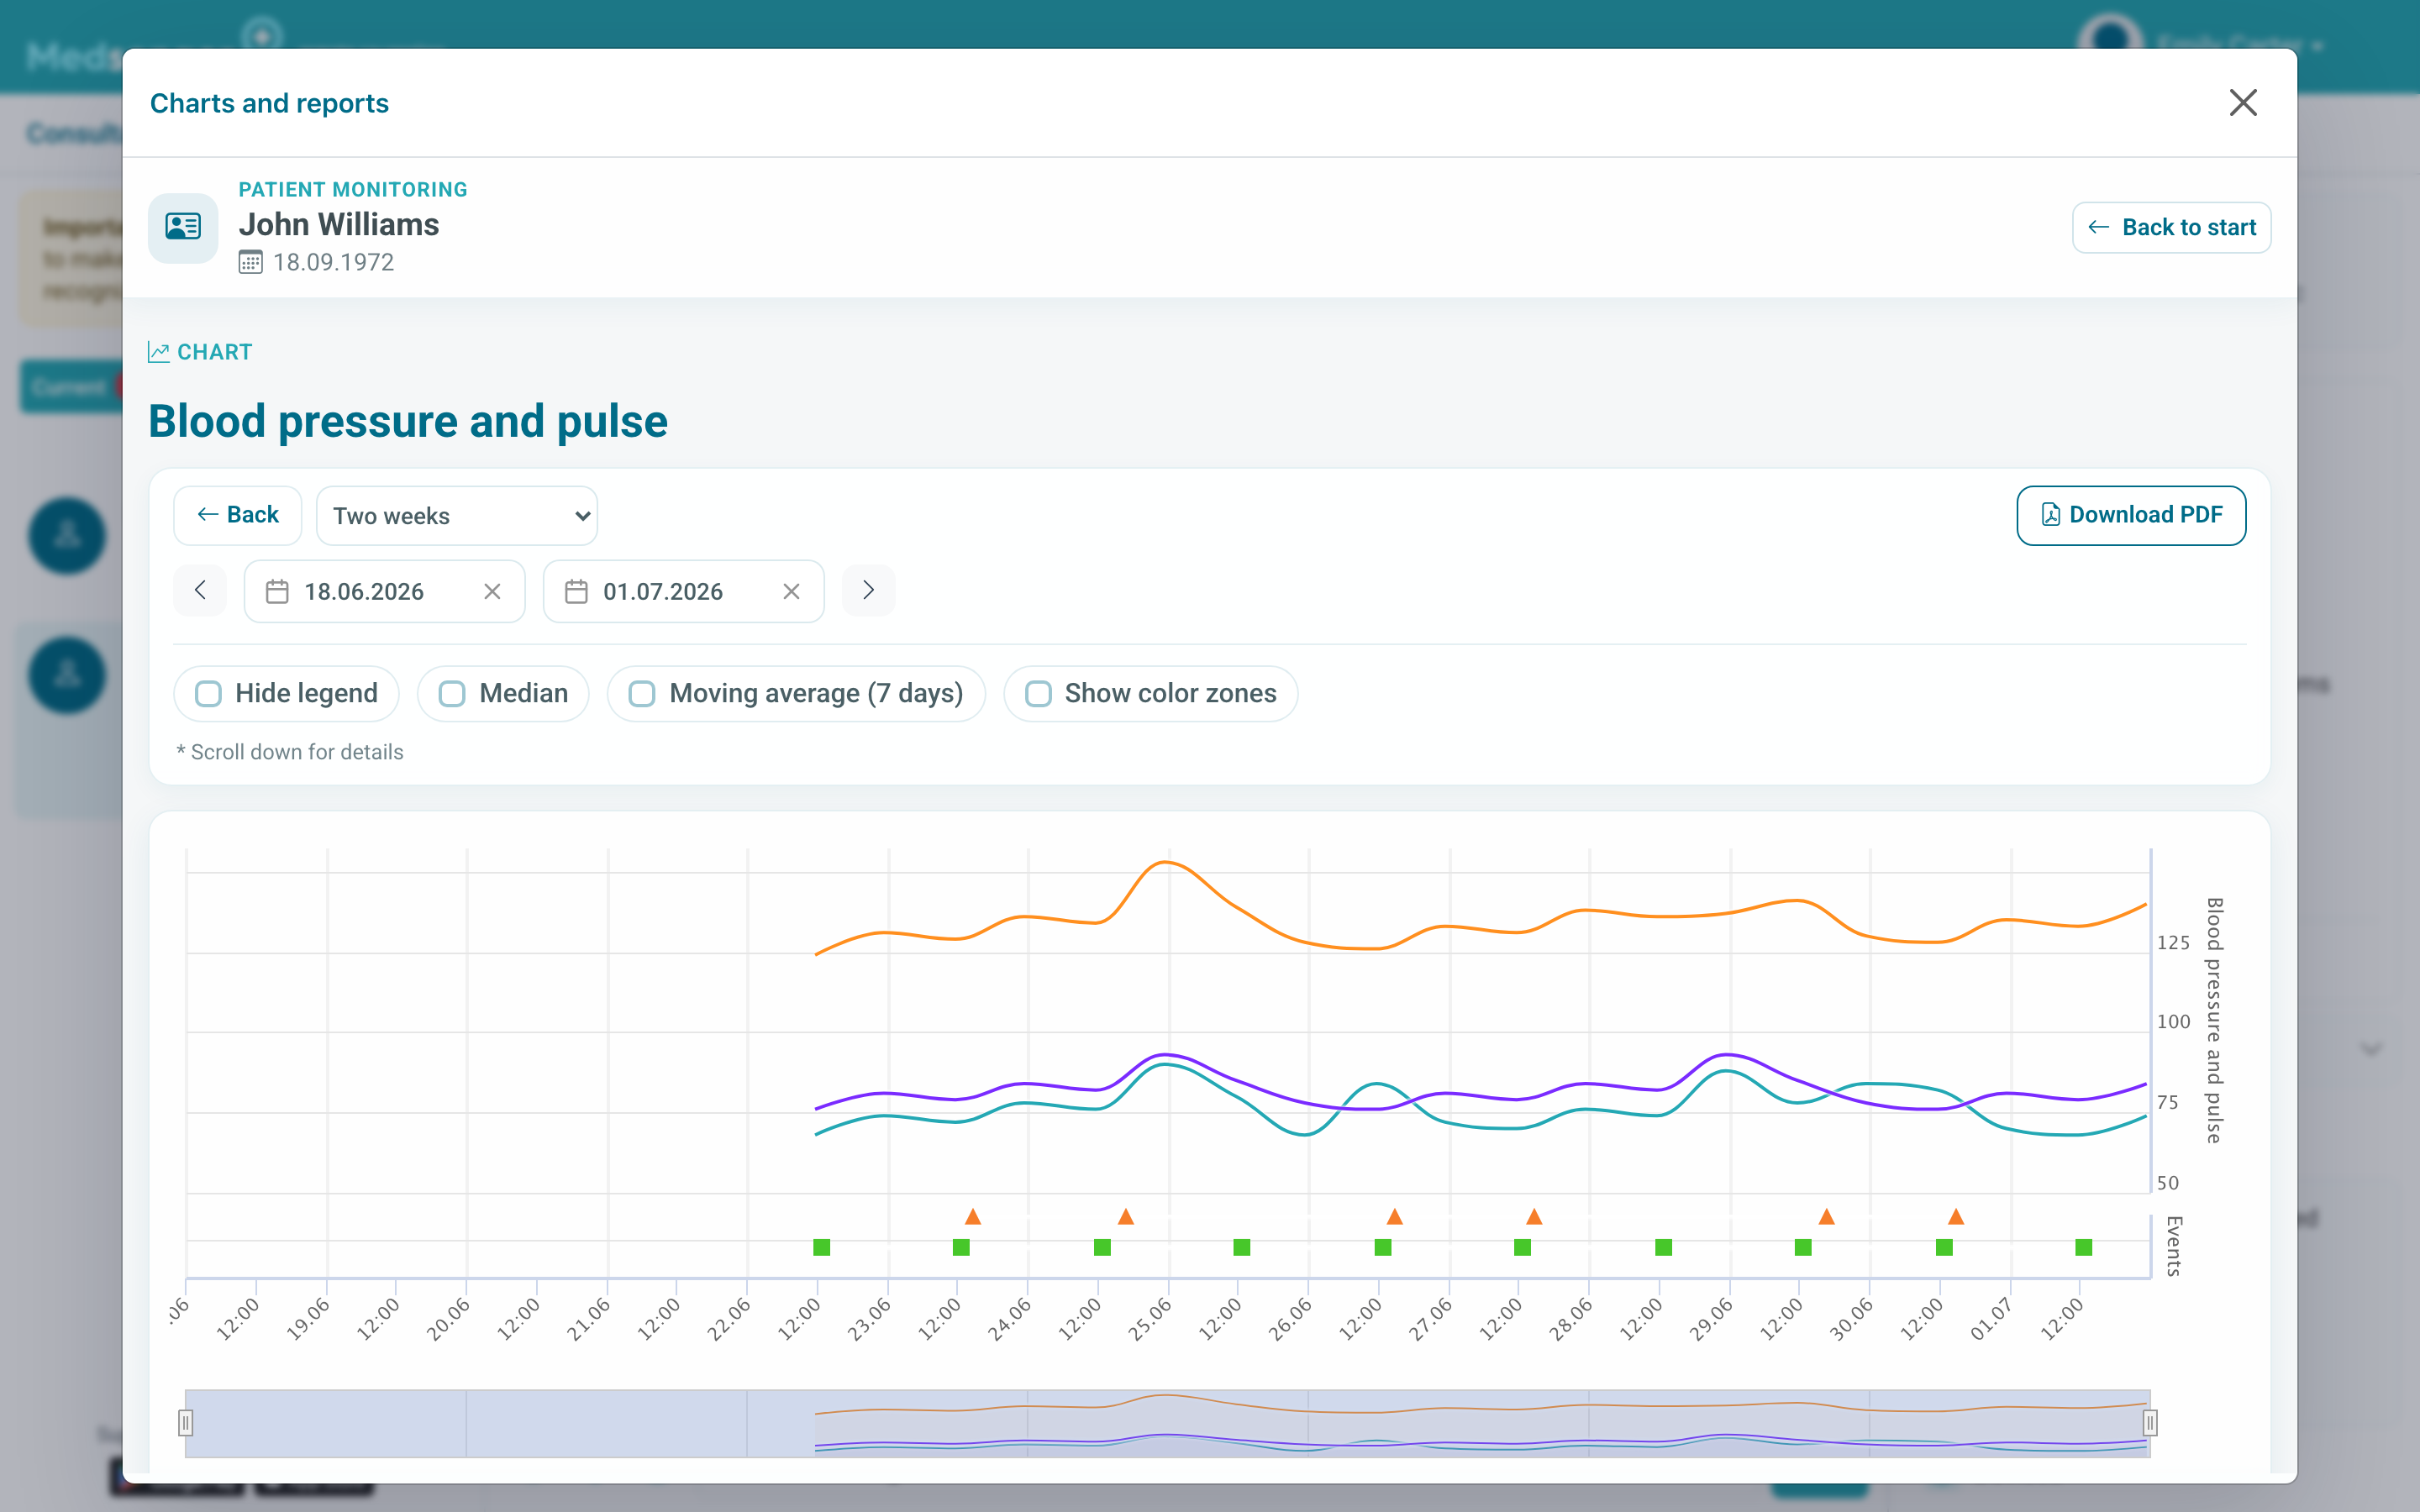
If a value looks incorrect, ask the patient how the measurement was taken and compare it with neighboring points on the chart.
How do I read heatmaps?
Heatmaps help quickly see on which days symptoms, complaints, medication marks, or comments appeared.
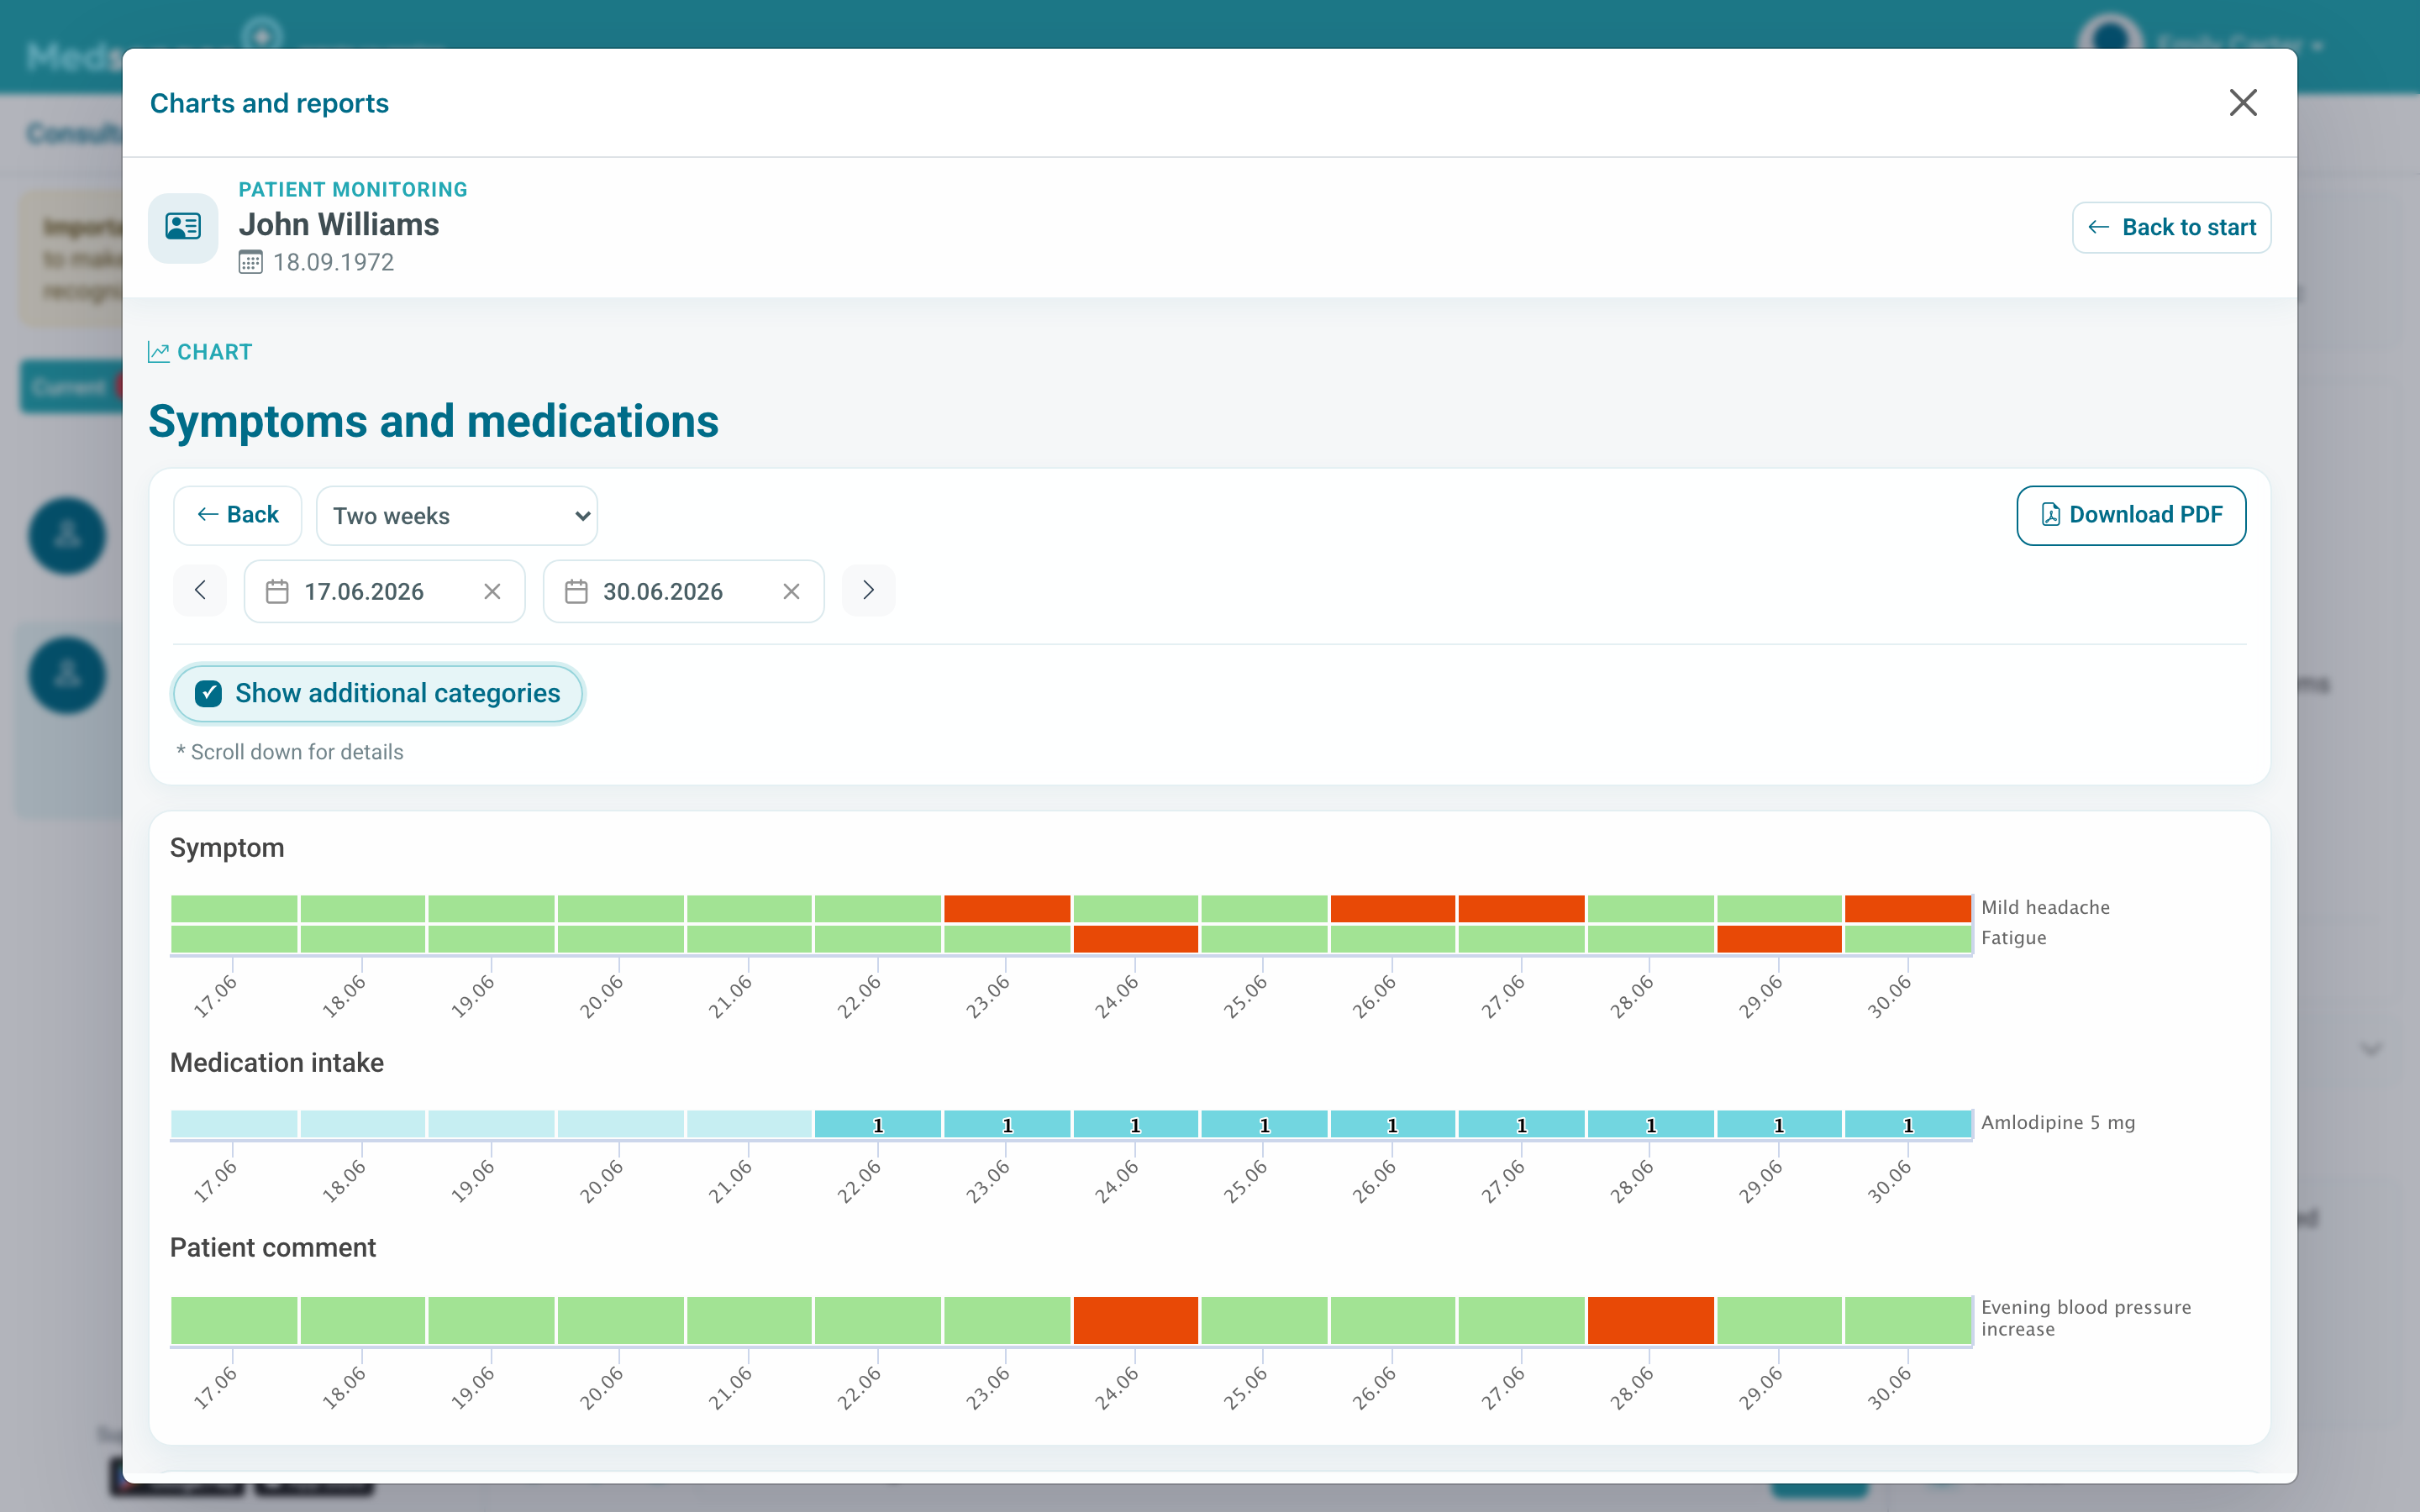
Use them together with charts: this makes it easier to compare indicator changes, complaints, and assignment completion. One bright cell shows a separate event, not the whole picture.