How do I view results?
If the clinic allowed access to medical data, the right panel of the subscription shows the Charts and reports button. There you can view the dynamics of indicators that you send to the doctor through questionnaires, manual entry, or medical devices.
What data is shown and where does it come from?
The set of data depends on monitoring and the doctor's assignments.
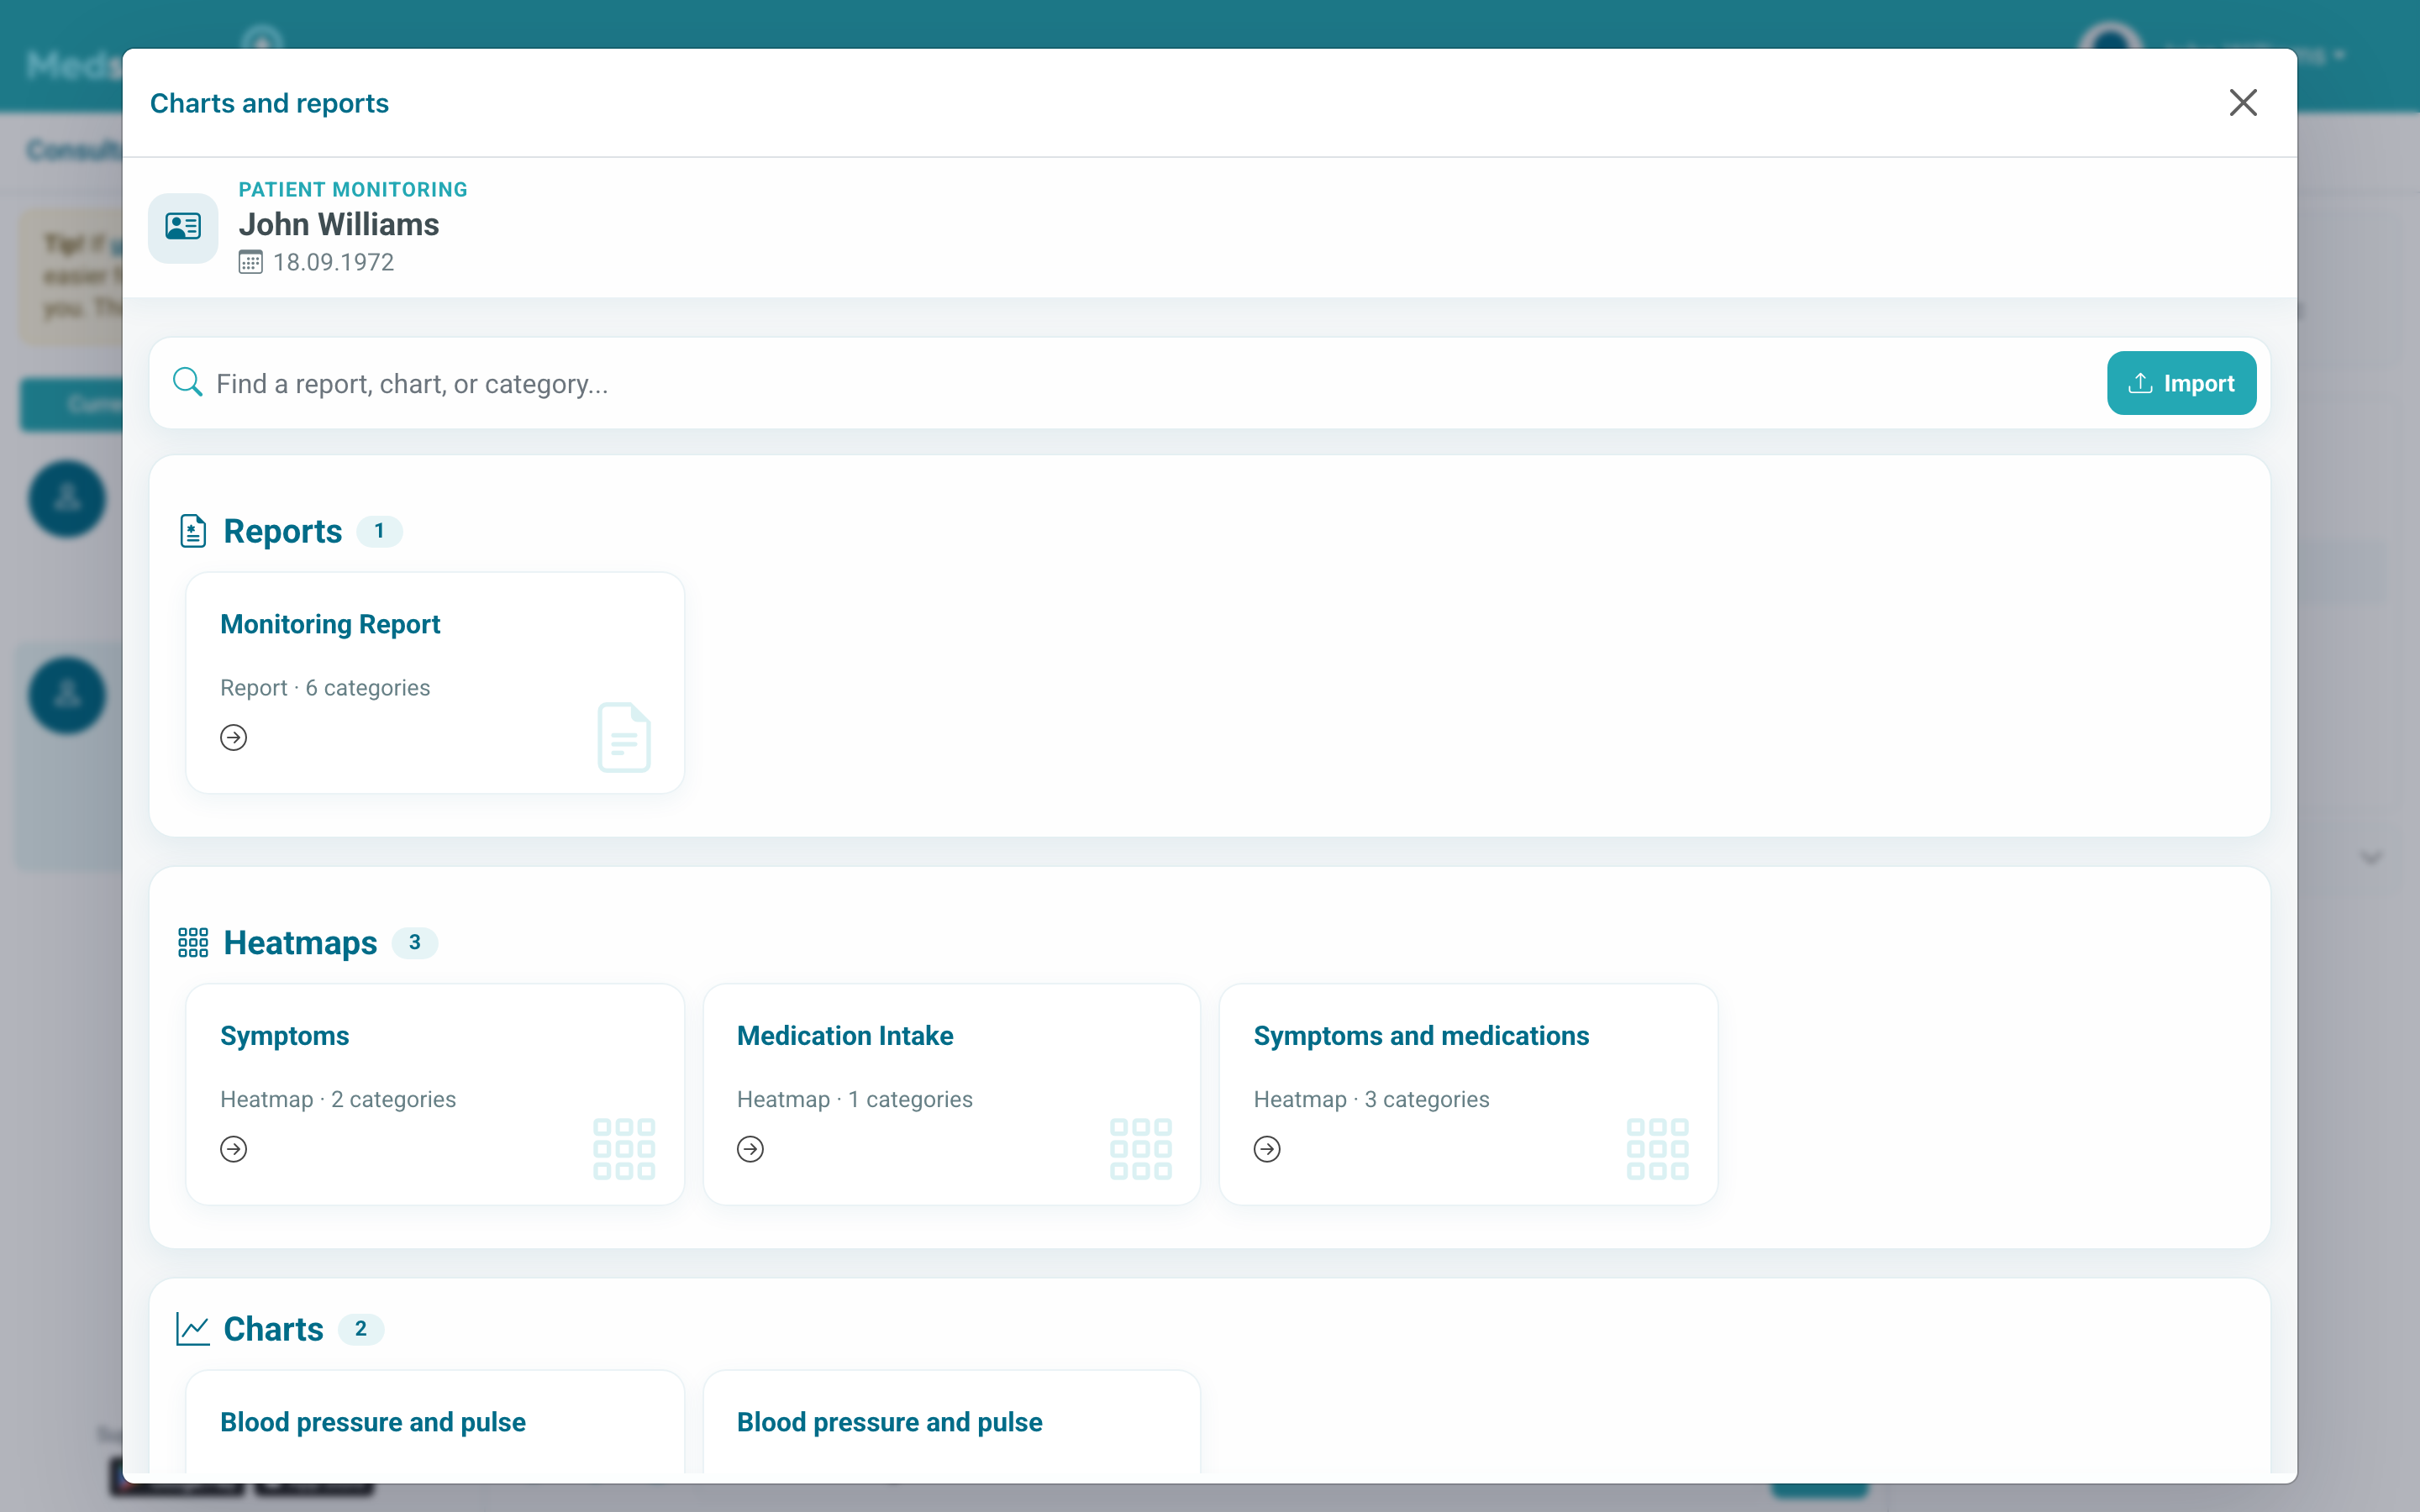
Usually the medical record may show:
- blood pressure and pulse;
- weight, temperature, saturation, or other numeric indicators;
- symptoms and complaints;
- medication intake marks;
- patient comments;
- examination results;
- medical device data.
If an indicator is not related to your consultation, it may not be shown in the report.
Data enters the medical record from questionnaires, manual indicator entry, medical devices, Apple Health or Google Health Connect synchronization, medication marks, and comments.
How do I open the medical record?

- Open the needed subscription.
- In the right panel, click Charts and reports.
- Select a period if you need to view data for specific dates.
- Open the card of the needed indicator or report.
On a phone, the right panel may be hidden. Use the button for opening subscription information or swipe between columns.
How do I read charts and heatmaps?
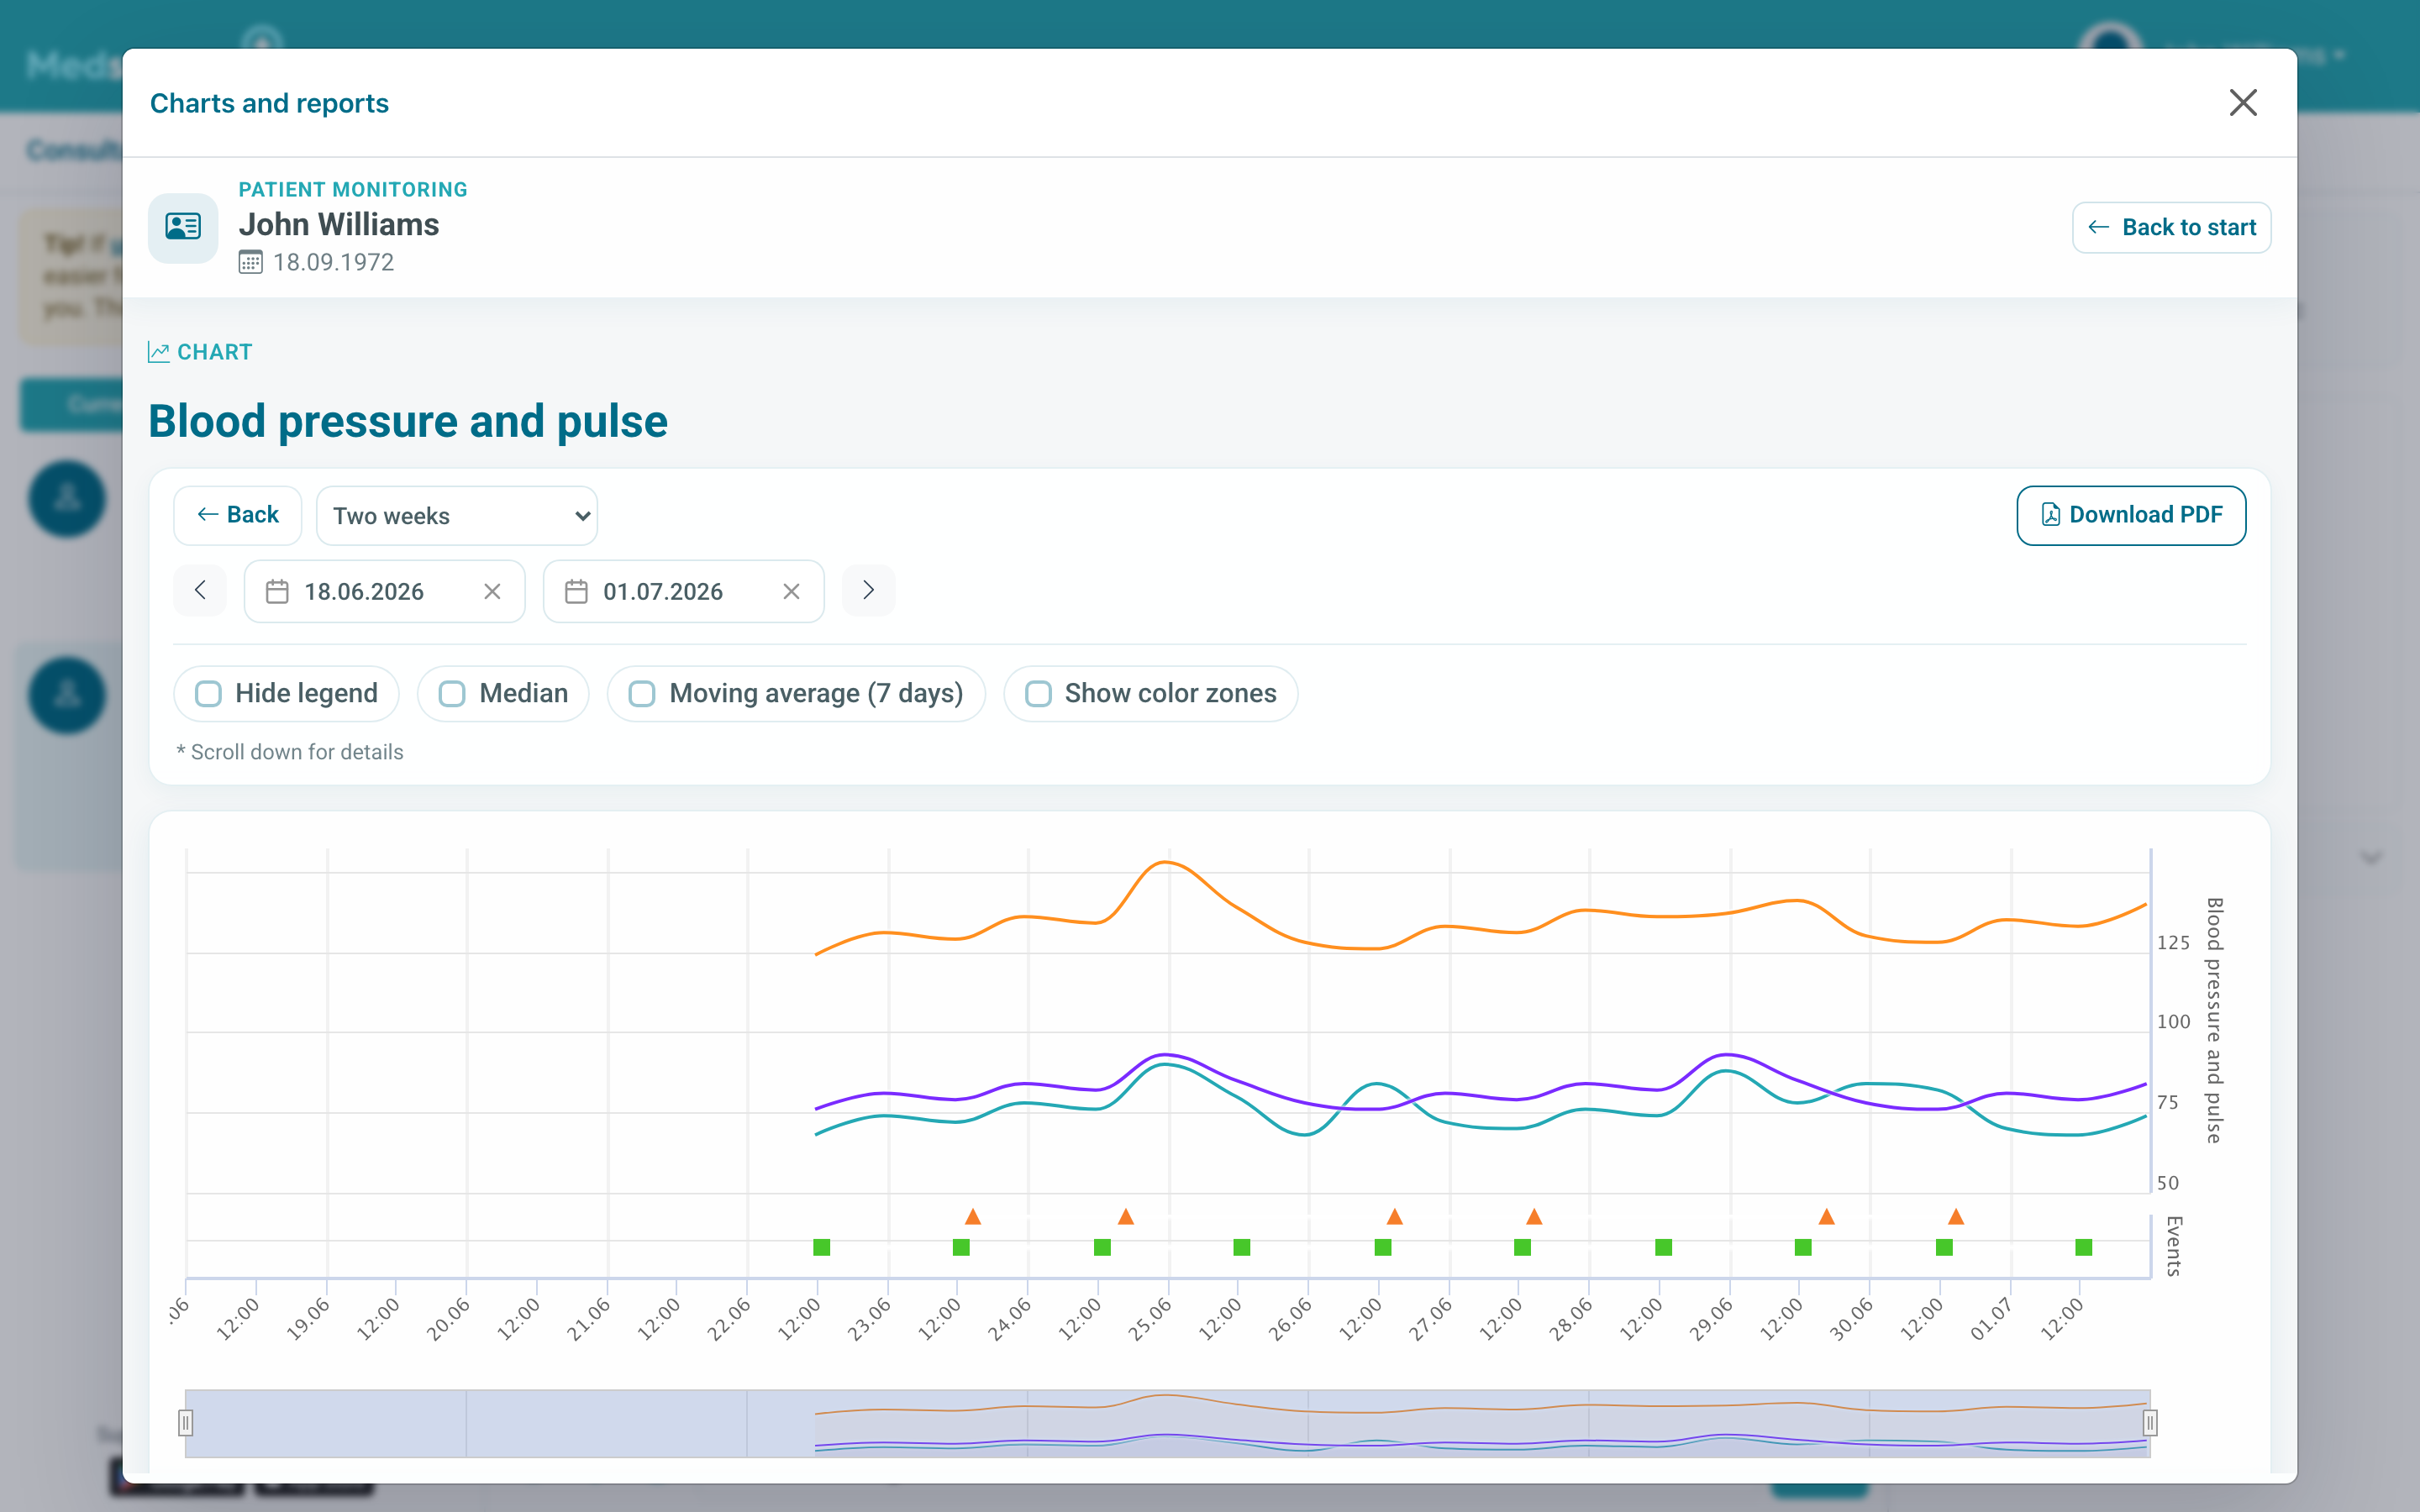
Numeric indicators are usually shown on charts. This is convenient for blood pressure, pulse, weight, and other regular measurements.
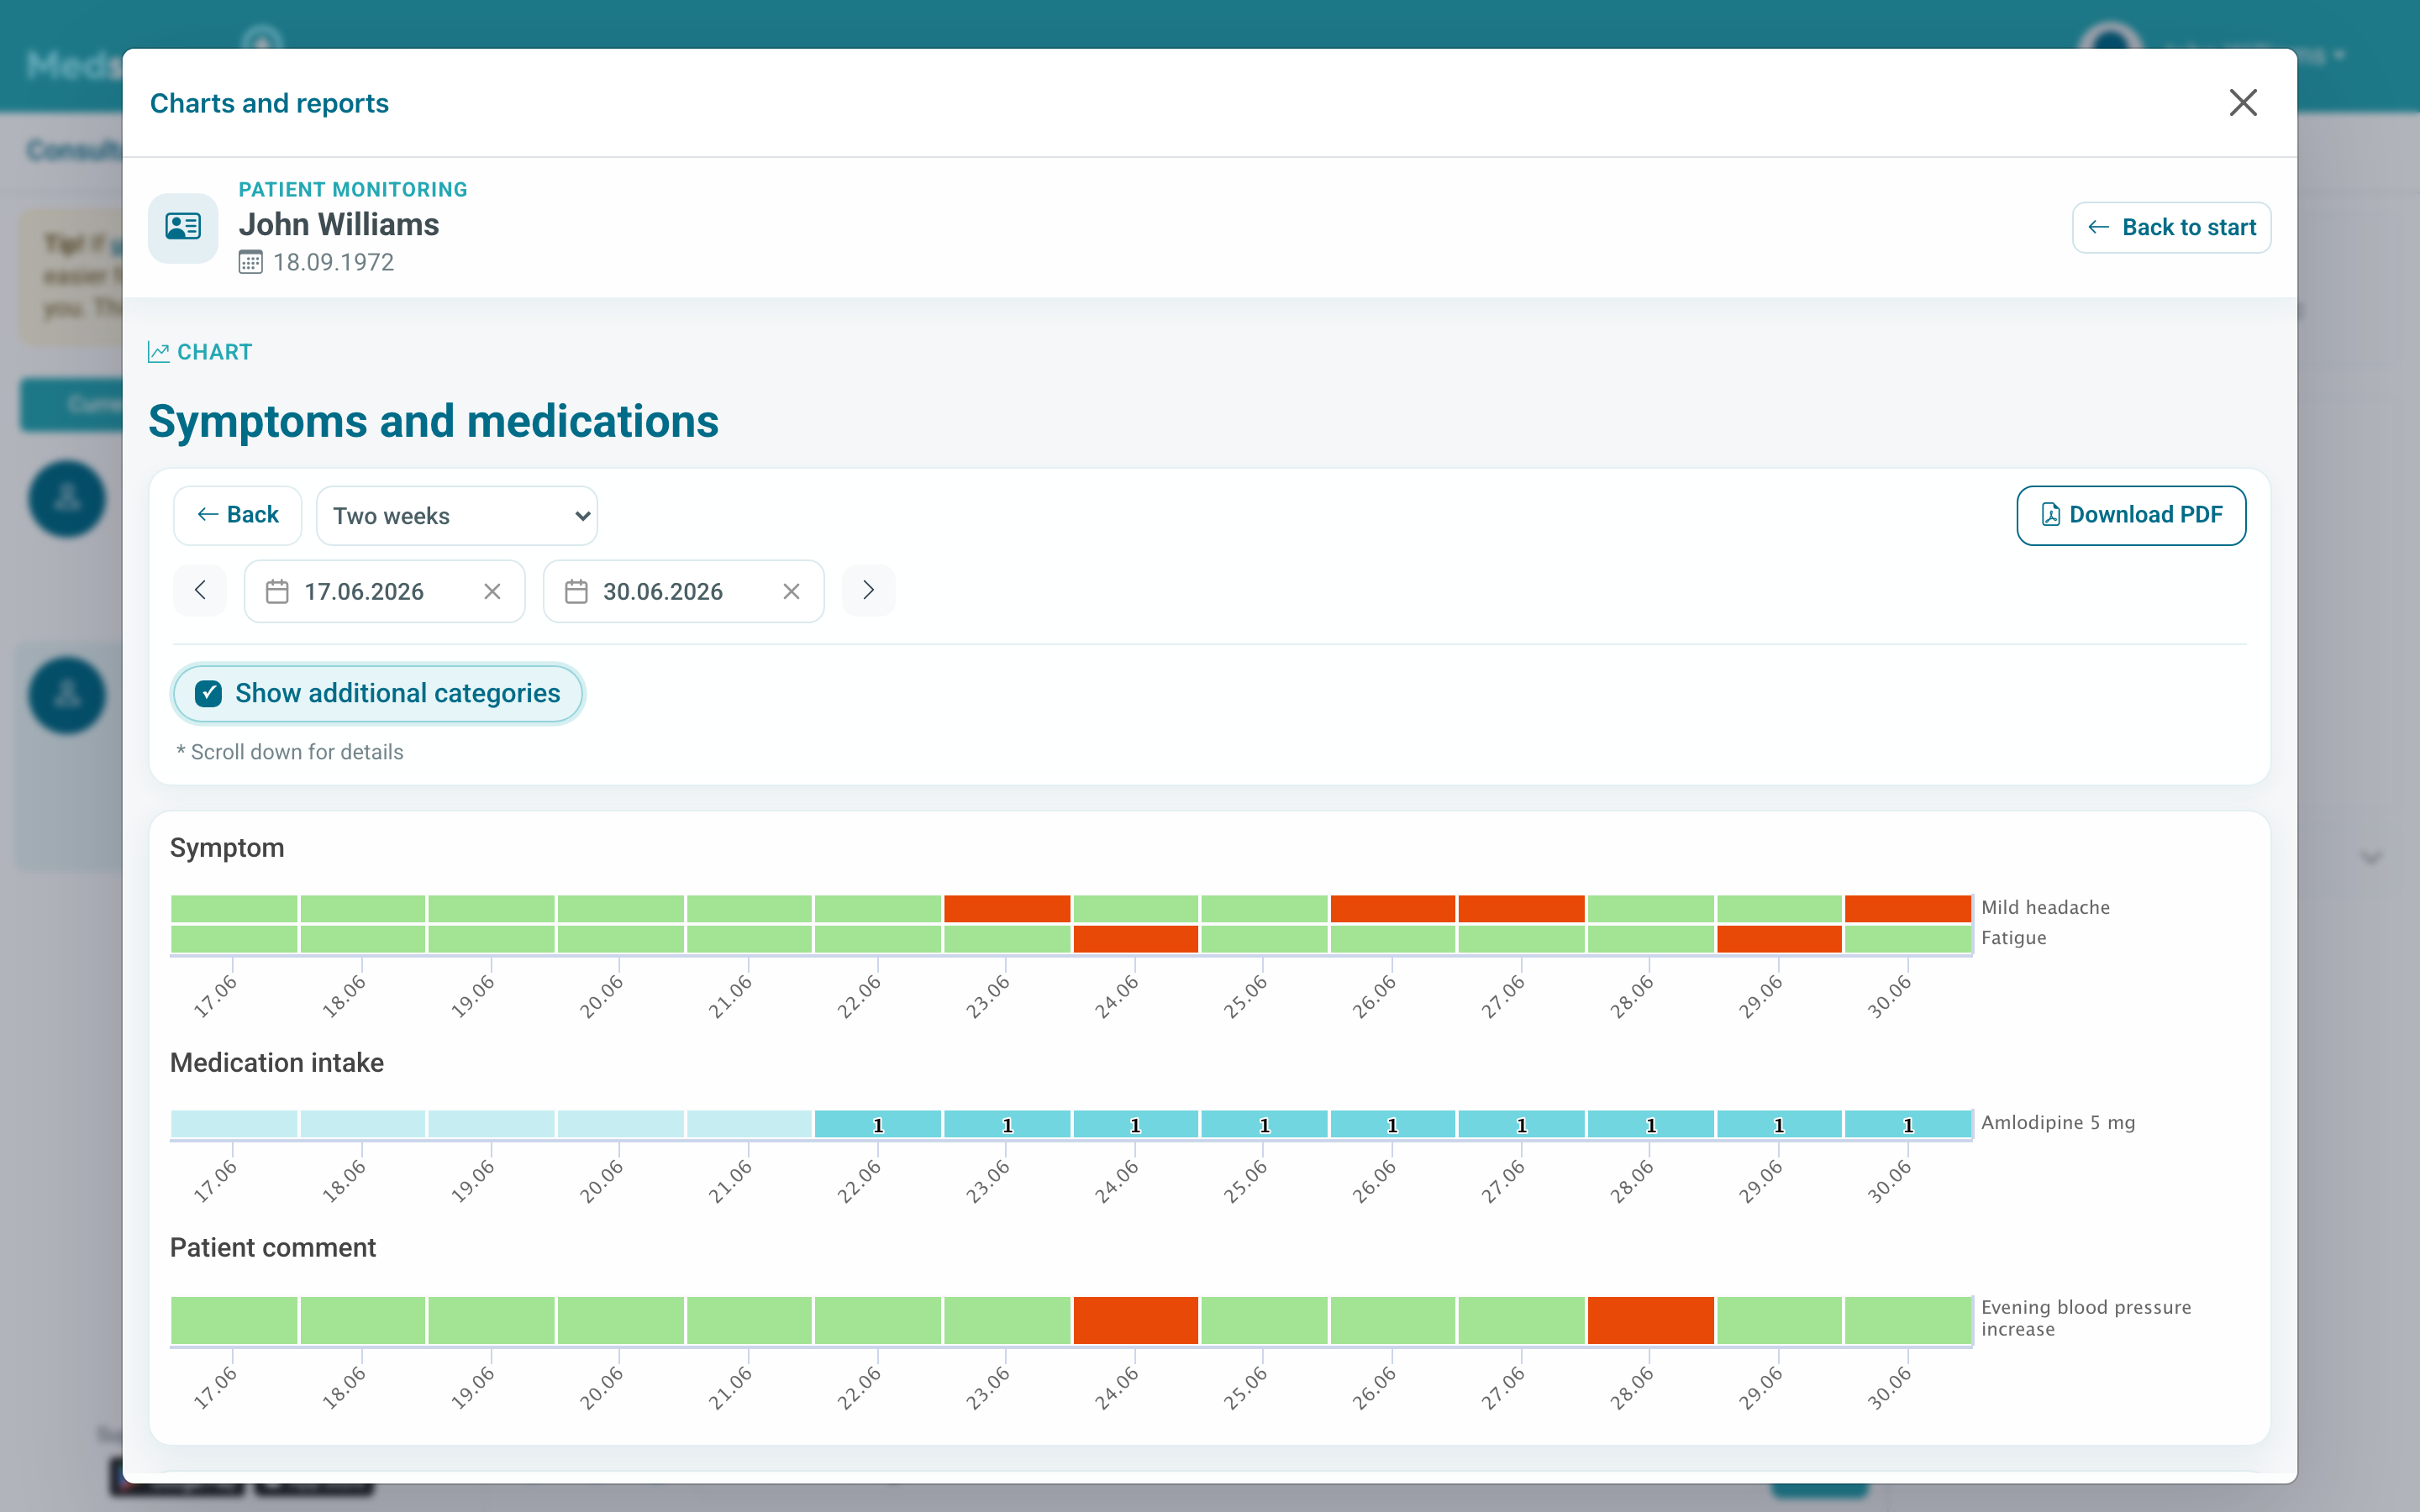
Symptoms, medications, and comments may be shown as heatmaps: they make it easier to see on which days complaints appeared or medications were taken.
If you have just filled in a form, the data may not appear immediately. Refresh the page after a few minutes.